There are several good resources for advanced monitoring of FileMaker Server, including configuring for use with Zabbix. Hower, it’s non-trivial to set up and configure the necessary resources.
Additionally, it has always been a challenge to troubleshoot a server or individual processes that may not have completely crashed but continue to run and become unresponsive. In that case, the process may be running. Testing to see if the process is running will not produce an error. In case it does crash, the FileMaker scripting engine (FMSE) will restart on its own. It may also cause a dump file to be placed in the Logs directory. The former case – where FMSE does not crash but becomes unresponsive – is harder to detect.
When FMSE Becomes Unresponsive
There are various reasons why FMSE might become unresponsive. One such scenario may be a scheduled script that has no timeout set. It may continue to run even if it gets hung up in the middle of a script. Another possibility could be that an under-provisioned server is under too much load and becomes unresponsive, even though all processes are still actively running.
Another example might be that the web publishing engine has become unresponsive, trying to process too many requests at one time, possibly from suboptimal search requests such as finding on related fields.
For the circumstances we have outlined above, an alternate approach may be better suited to deal with this issue. And it wouldn’t require separate servers or running active agents on the host server.
Dead Man’s Switch
Using the concept of a dead man’s switch, we do not have to rely on processes running on the server itself to handle reporting errors. We have an alternative FileMaker Server monitoring method. If you have ever operated a lawnmower, you know what a dead man’s switch is. The mower engine will automatically shut off if you release the handle. The idea is that if the operator becomes incapacitated, for whatever reason, a process can be activated or deactivated.
Leveraging AWS CloudWatch
A simple, low-cost method of configuring a dead man’s switch for a FileMaker Server is to utilize a service such as CloudWatch in AWS. We can use the AWS API to create a custom metric in CloudWatch, at an interval that meets your requirements. For example, you can “PUT” a metric once every minute that can simply have a value of “1” like a ping.
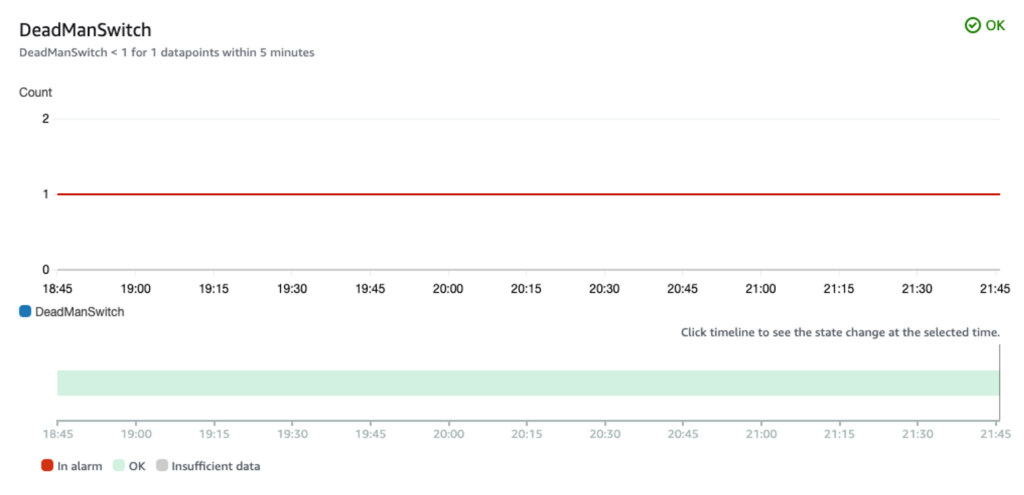
Once that is in place, we can create an alarm in CloudWatch. Again, the threshold that you configure here is going to be variable and should work with the interval you configure above to put the metric from FileMaker Server. As an example, we can configure the alarm to check every five minutes, where we watch for a statistic of Minimum looking for a threshold lower than “1” to trigger an alarm.

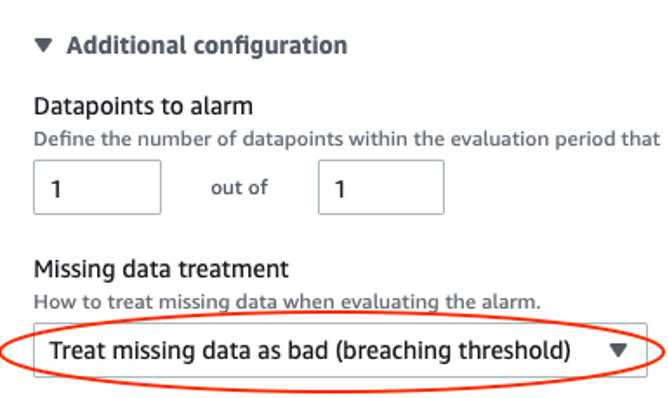
Additionally, and importantly, we will also “treat missing data as bad,” which is effectively breaching the threshold.

We are effectively looking for a negative, so when the metrics fail to get put in CloudWatch, it will trigger the alarm. The action you take will depend on how far you want to go with setting up automation. In our example, sending a notification to an email list, which can be easily configured in AWS by posting to an SNS Topic, allows us to receive notification or take some other action, as needed.
Conclusions
I would be cautious about putting too much automation in place, such as restarting a server or individual services. However, receiving a notification when specific services become unresponsive, regardless of their running state, is valuable. More likely, it would warrant manual intervention and review of any causes for services to be down or unresponsive. Getting notified early of a potential issue helps us to isolate problems and resolve them quickly.
By utilizing cloud infrastructure to automate external monitoring of our critical resources, we can improve the overall reliability of our deployments without adding any significant costs to do so. If you’re interested in this type of FileMaker Server monitoring for your FileMaker solution, our team can help. Contact us to get started.
Alternately you can use a free service like UptimeRobot.com and ping the myserver.com/fmi/xml or any public endpoint for data returned by the server.
For more robust monitoring we at FM BetterForms recommend something like site24x7.com where you can monitor a ton of internal metrics like disk volume and average CPU for higher system availability. This service can self configure for common scenarios and you can even read log files via the site.
For even more thorough monitoring we have an internal timer that runs in FMS ( via scheduled script every minute) and that pings site24x7 that its health is ok. This also assures the script engine is functioning and your system event timer is also up!.
Charles
Yep, lots of different ways to do this. We also do more thorough monitoring with other methods like cloudwatch, which can be further automated since we control the scriptable infrastructure as well.