stats.log on FileMaker Server
There is no log file more important on your FileMaker Server then the ‘stats.log’. It delivers invaluable information on how your deployment is behaving across the four traditional bottlenecks of any server:
- Is the processing power sufficient?
- Can the disk speed handle the volume?
- Is there enough memory available?
- Does the network card give me enough bandwidth?
The information in that log will help you troubleshoot performance bottlenecks in your solution. The stats.log also will help you plan and extrapolate whether the current server can handle any new load you have in mind. It will inform you if it is safe to use more PSoS or more server-side schedules or add a few WebDirect users. Without this log, you are, in effect, flying blind.
stats.log in FileMaker Server 16
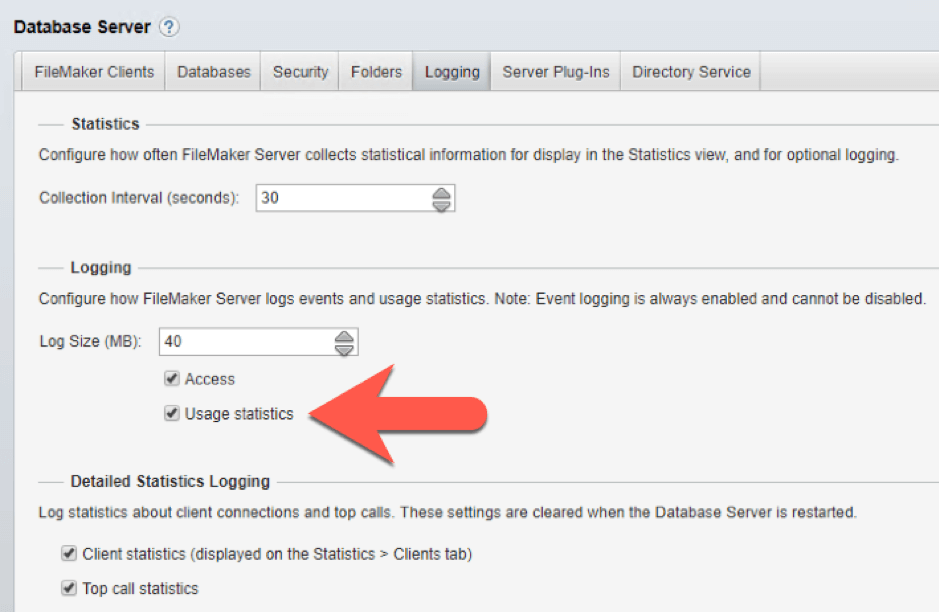
In FileMaker Server 16, the toggle to enable this log was in the Admin Console as shown below:

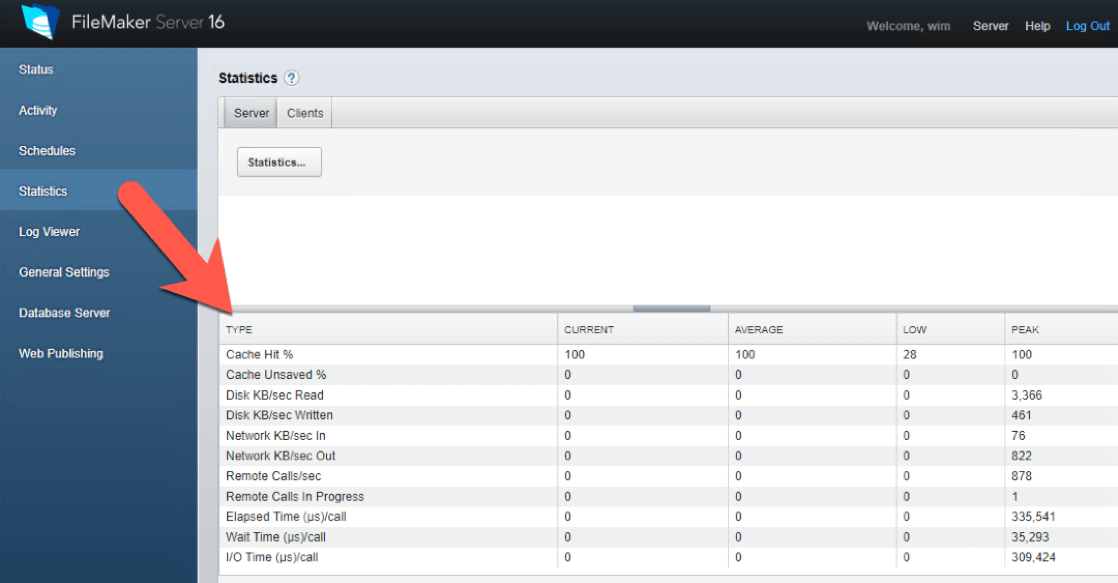
The statistics themselves were visible in the Console too as shown in Figure 2:

That is not so anymore in the new FileMaker Server 17 Admin Console.
stats.log in FileMaker Server 17
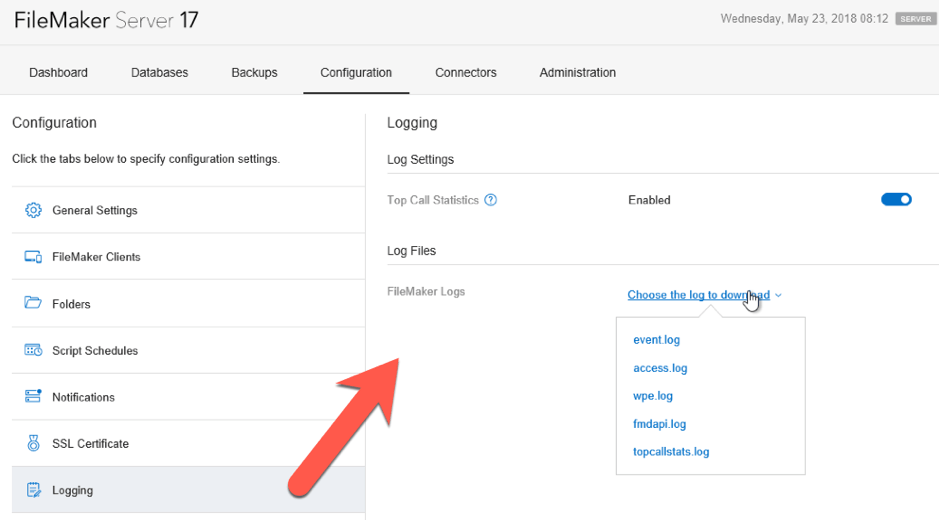
In the FileMaker Server 17 Admin Console, you can only toggle the top call stats log. To view any of the logs, you must download them (see Figure 3):

Finding the stats.log in FileMaker 17
As per my previous blog post on missing features in FileMaker 17 illustrates, you may think the stats.log is no longer available in FileMaker Server 17. Rest assured: it is still there.
However, it is also still turned off by default. (I really wish it wasn’t.) Because we do not get visual reminders of of this in the new Admin Console, you may easily forget about it.
Turning on the stats.log in FileMaker 17
The very first thing I do when I install a new FileMaker Server or log into one already running is turn on the stats.log. I do not like flying blind…
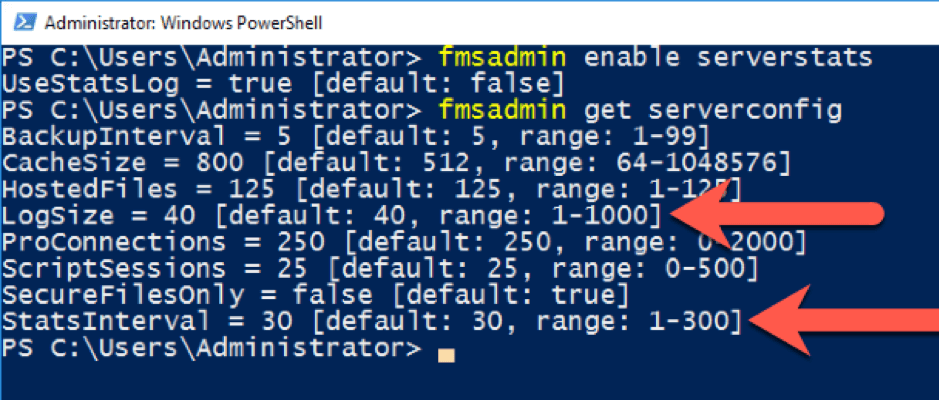
In FileMaker Server 17, you can only do so from the command line on the server itself – or through a secure tunnel to the command line on the server (see Figure 4):

While you are there you can also enable the Client Stats log:
fmsadmin enable clientstats
That client stats log as well as the top call stats log will turn themselves off on every FileMaker Server restart, but the regular stats.log will remain on after issuing this command.
Next, I will verify what the logging interval is and how big the log size setting is:
fmsadmin get serverconfig:The default settings of logging every 30 seconds and keeping the log size at 40MB is usually sufficient. If you want to change them, the command would be:
fmsadmin set serverconfig statsinterval=15This, for example, would change the interval to 15 seconds.
Accessing Your Data in the stats.log
Now that we can sleep easy knowing our server deployment will log valuable performance data, how do we get the data when we need it?
You cannot download the stats.log and the ClientStats.log from the Admin Console. You will need to grab them from the FileMaker Server logs folder (see Figure 6).

Questions About the stats.log
As always: post any questions on community.filemaker.com or as a comment on this blog, and we’ll be happy to help out.
For a full run-down of the new Admin Console, the configuration options that are available from the command line, the new Admin API and the new Console, and a dedicated Tech Brief on monitoring your FileMaker Server, download comprehensive white papers.
Leveraging New Features in FileMaker 17
If you have any questions about how to benefit from the features in FileMaker 17, please contact our team. We’re happy to help your team determine the best way to leverage new functionality for your FileMaker solution.
Hi Wim; I know this is an old article but it is very useful in conjunction with Joe Martin’s piece in 360Works (https://www.youtube.com/watch?v=OrIzPblqbuU) for me to begin interpreting the FMS Top Stats logs. Your info (above) about enabling the clientstats.log seems critical to the 360Works presentation but I haven’t seen it mentioned elsewhere: One thing I can’t seem to be able to do is to get all three .log files to cover the same time period. Is this important? If so, do you have any recommendations as to how to synchronise them for the period tracked? [If you would prefer I posted this question elsewhere for more coverage for you, please don’t hesitate to tell me!] With thanks and kind regards; JB.
Hi John, can you expand a bit on the time syncing? FMS keeps a single default logging interval that applies to all 3 logs and while there can be some drift during the day, the all start initially when FMS starts.
Thanks, Wim. When I pulled the files yesterday for a first attempt, there were over a thousand topcallstats for a whole variety of times depending on when I had enabled/disabled log writes, and a load of different times on the stats.log; but there were only very few client stats. It seems to me (and I appreciate I may be wrong!) that each of the three .logs files can be enabled independently and thus won’t necessarily harmonise. I was hoping it may be feasible to delete (or rename) each of the files in the logs directory when logging is not enabled, then, when it is enabled, new .logs may be created that will be covering the same time periods! But I didn’t want to risk this and break anything! On a slightly ‘nother topic; Many of the bigger scripts are writing logs to the users’ machines and I’m looking to include these in the file so I can track what script caused which actions. Do you have experience in that or can offer any advice in that respect (e.g. about setting time offsets, etc)?
A couple of thoughts:
– use the fmsadmin CLI to stop all 3 stats log and start them again; that’s a good way to make sure they all capture at the same time. There will be some drift over time but that shouldn’t get in the way too much.
– only move or delete the logs after you make sure FMS is not using them
– time offsets with your own logging: make sure all machines sync their time against a time server to minimize drift. Use the FM feature get(CurrentTimeUTCMilliseconds) to capture time, so that all your logs will be in UTC. If you don’t know what offset your users will be then also capture the regular timestamp and you can easily calculate the difference.