Diagrams provide a visual overview of a workflow and/or system, simplifying understanding and communication between development teams and users. At Soliant Consulting, my team and I use diagrams to present or create a shared understanding of how the client’s workflow currently works and how it could work, both from the business side and the technical side.
Ultimately, diagrams serve three major purposes:
1. Improving Communication
We primarily use diagrams to better communicate with our clients and between our development teams. Visual resources help create a common understanding to keep everyone on the same page. Sometimes we’re sharing a concept or a vision; sometimes, details are more complex and include technical specifications.
Diagrams allow us to digest everything the clients need and reflect these needs back to them in an organized, consumable way. When everyone can visually see the process or proposed system, it makes collaboration much more targeted – we spend less time explaining and more time building and improving processes.
2. Understanding and Documenting Complex Workflows
At Soliant Consulting, we specialize in taking very complex processes and leveraging technology to streamline and simplify them. These can be manual processes – for example, instead of a customer having to call a store to see if a product is in stock, we can display images and inventory numbers of each product online. Or sometimes, the opportunities lie more in data and analytics– for example, we’ve helped business leaders simplify their reporting and analysis from dozens of spreadsheets to one simple dashboard, automatically and regularly updated with data integrations.
When our clients walk our teams through their processes, the details can feel overwhelming – both to them and to us. Diagrams help visualize the workflow and boil it down, therefore reducing complexity. They also make it easier for our business analysts to see where steps can be improved or even eliminated with better technology.
With this information, we can deliver documentation on how technology can improve our client’s existing workflow, showing how it will function for their users.
3. Driving Collective Agreement Between Teams
We often come across teams with differing internal opinions on how their current workflows work, making coming to a consensus on how new ones should work almost impossible. Diagramming helps the clients better understand their own needs and makes internal debates more productive. They help clarify some of their thoughts and ideas to drive better agreement on direction, which in turn, helps our business analysts and system architects design better systems that our clients love.
Diagramming Best Practices
1. Simplicity
The biggest rule of diagramming is to keep it simple. If the creator of the diagram has to explain it, it isn’t simple enough. The visual aspects should speak for themselves and clarify complex thoughts and ideas through content flow. If you need to walk your audience through the diagram, it needs revision.
2. A Clear Objective
You should never make a diagram without a clear goal and audience in mind. The diagram itself will be dictated by who needs to view it and what decisions they need to make with the information it provides. The scope and detail of a diagram can and should vary widely depending on the goal. Is this diagram going to be used to guide technical implementation, or are we instead presenting a business vision to an executive stakeholder? You can imagine those two diagrams would be vastly different. Diagrams must include the data required for their intended audience to make the decisions you want them to make or the general understanding you want them to leave with.
3. Organization
Diagrams serve a basic purpose – to present information visually. If disorganized, this information lacks meaning because it becomes less understandable. Your audience should be able to easily see the information most important to them and how it flows from one process to another.
4. Visually Consistent
Considering a diagram is a visual representation of information, you’d be surprised at how little some think about, well, the visual aspect of it. Shapes and lines connotate information and should be consistent throughout your diagram. What does your box with a sharp edge mean versus your box with a rounded edge? What do circles represent? Do you use arrows to show the direction of your flow? These decisions help communicate ideas and their meaning to your audience so take care when making them. For bigger diagrams with more elements, consider using a legend to help your audience understand key definitions.
Don’t forget to consider diagram levels, either. Your information flow should be intuitive and simple to digest.
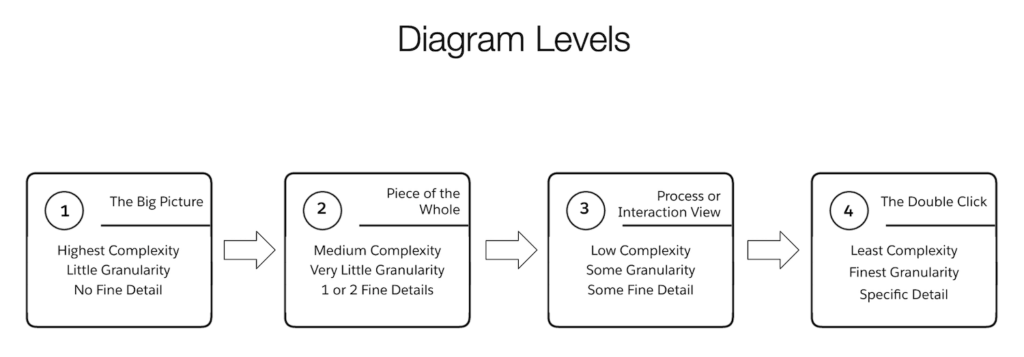
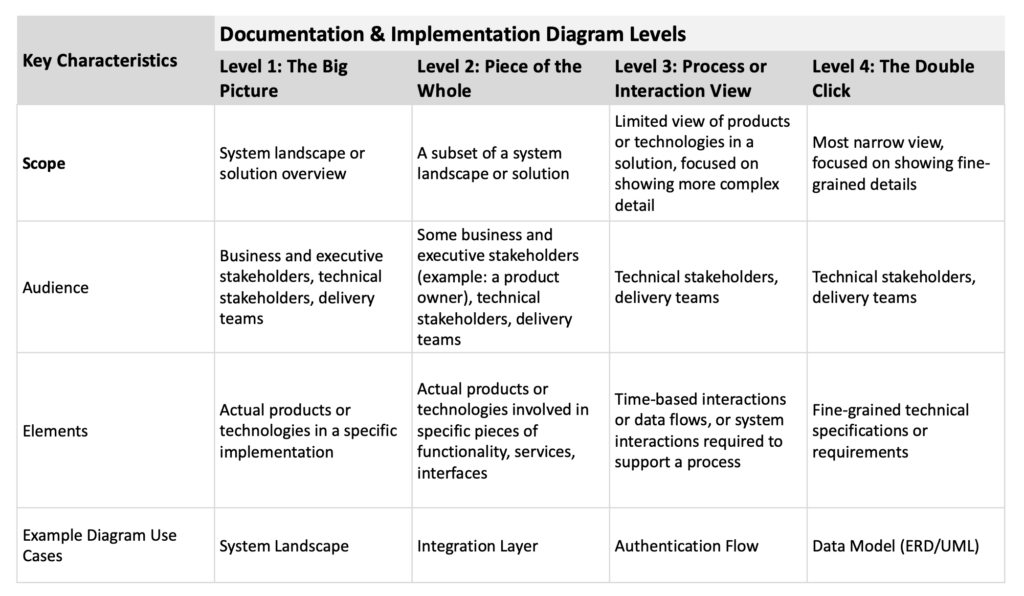
Soliant’s Two Preferred Diagram Types
There are dozens (hundreds?!) of diagram types out there. However, at Soliant Consulting, we gravitate toward two specific types when working with our clientsSoliant’s Two Preferred Diagram Types.
1. Marketing, Strategy & Sales Diagrams
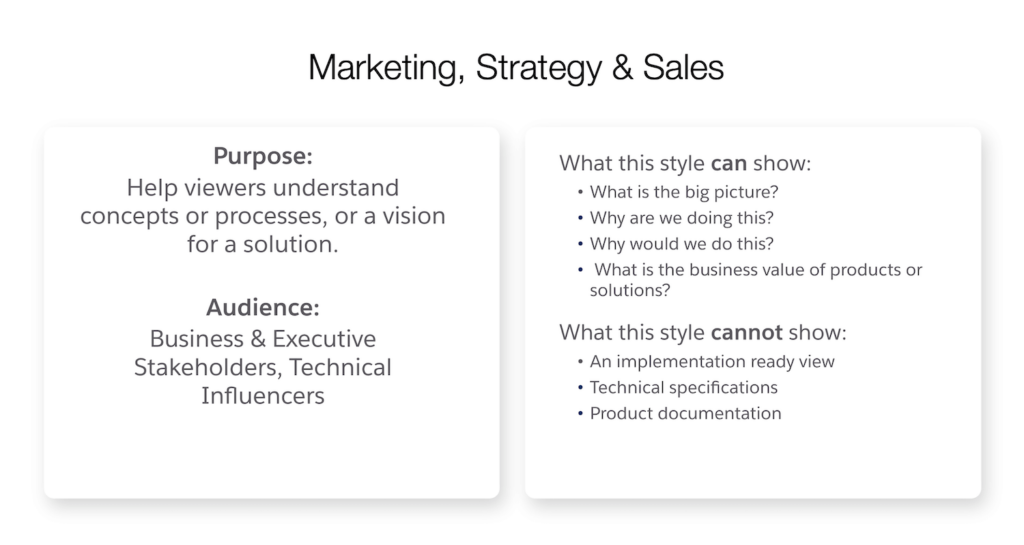
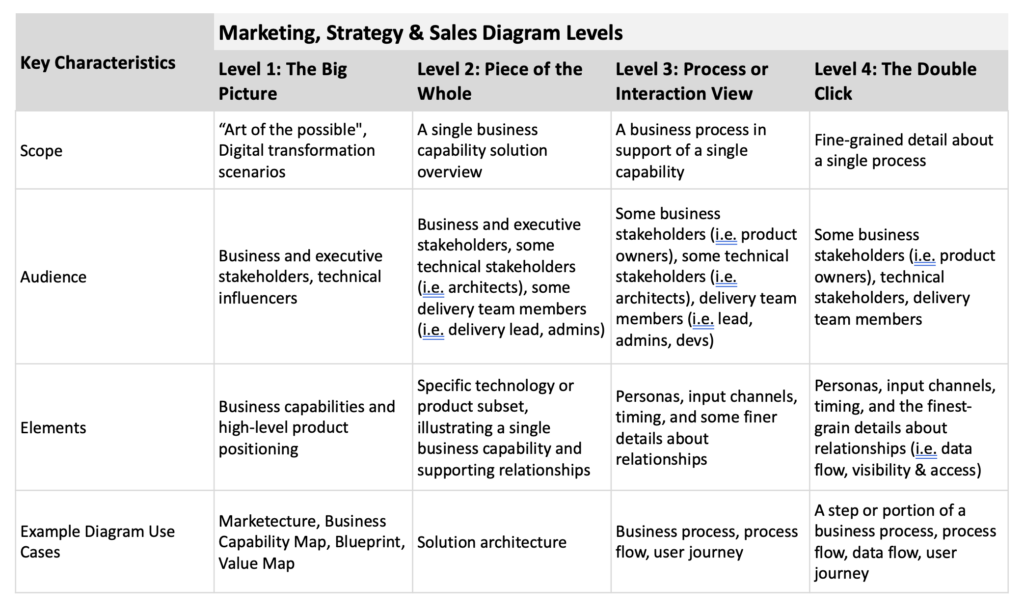
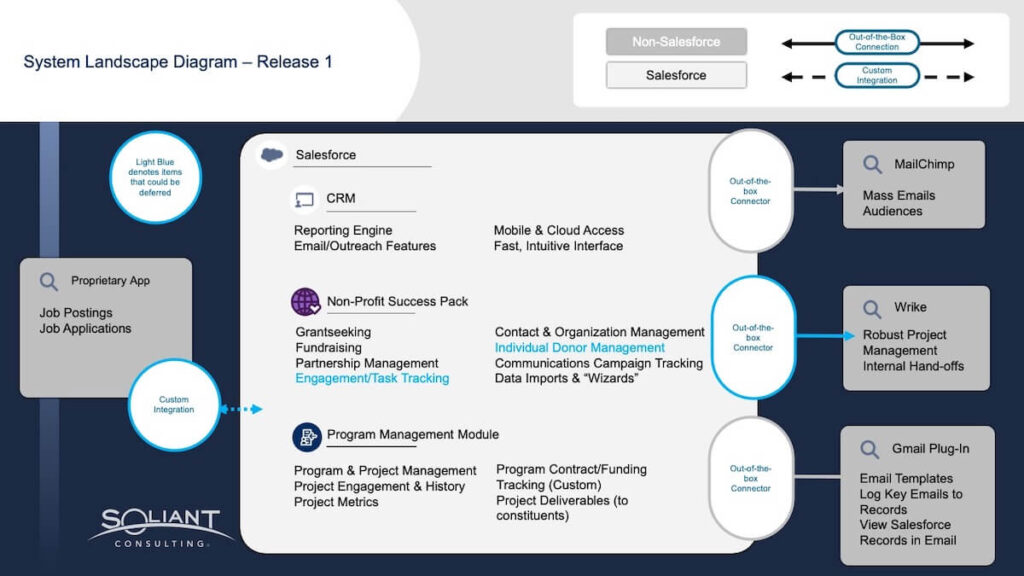
The stakeholders and their goals for our projects often vary. In many cases, we are working with business leaders at first. With this audience, we focus on sharing and explaining our vision for the business application we’d like to build them.
Diagrams help these stakeholders understand concepts, processes, and overall goals for our proposed solution. We lay out a vision for what the system can do, always focusing on the underlying business value our clients are pursuing. These diagrams paint a big picture and share the organization’s future state. Our goal is to convince business leaders to move forward with our application vision.
2. Implementation Diagrams
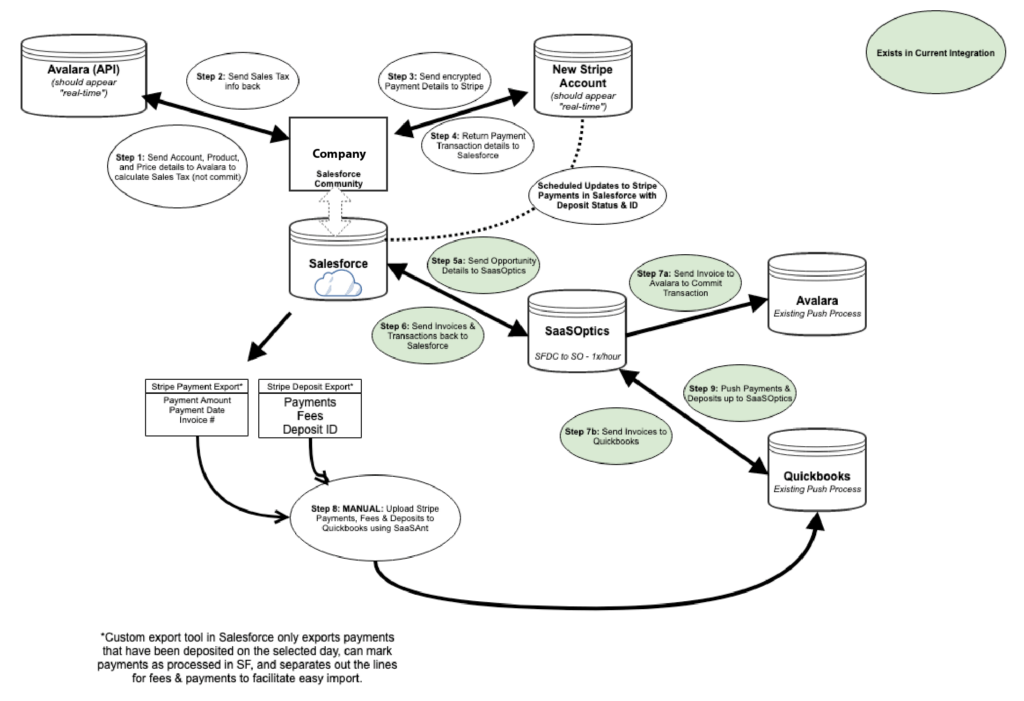
Implementation diagrams, on the other hand, go into much more detail and often include complex technical specifications. The intended audience is our client’s technical team, who need to know how our proposed solution works, not just what it does.
You can use this diagram type to outline a Minimum Viable Product (MVP), build a preliminary product backlog, and share detailed information on how integrations between systems and data flows function.
Building a Diagram with Your Development Team
When working with a consultant and development team, seeing diagrams of their understanding of your current workflows, their vision for yours, and an outline of their proposed application’s technical specifications is critical to a successful process. They inspire collaboration and demonstrate transparency. You should always have insight into how your project is going during the actual development process.
If you’d like to learn more about our processes or are looking for a consulting and development partner to help you build your business application, please contact our team.